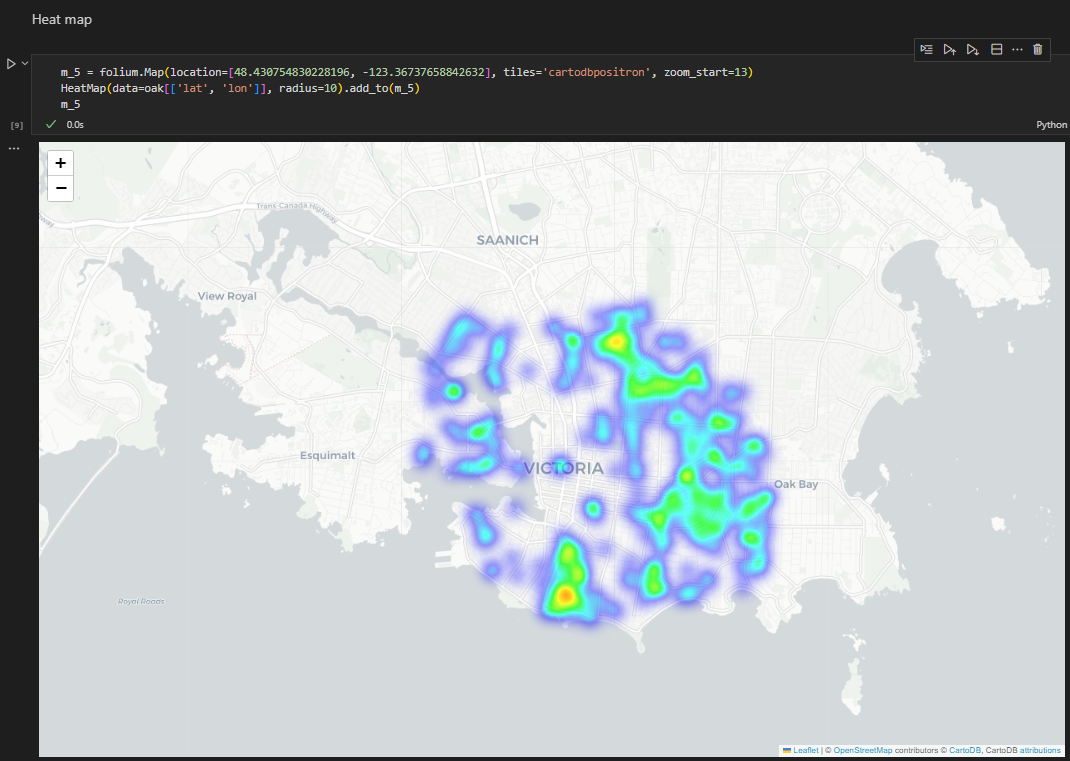
The maps below visualize the distribution of Garry Oak/ Oregon White Oak tree species in the City of Victoria using Folium, a Python library that utilizes JavaScript leaflet.js module for interactive map visualizations. The data comes from the City of Victoria's Open Data portal, and I analyze it with Folium plugins such as HeatMap and MarkerCluster, and GeoPandas Python libraries.
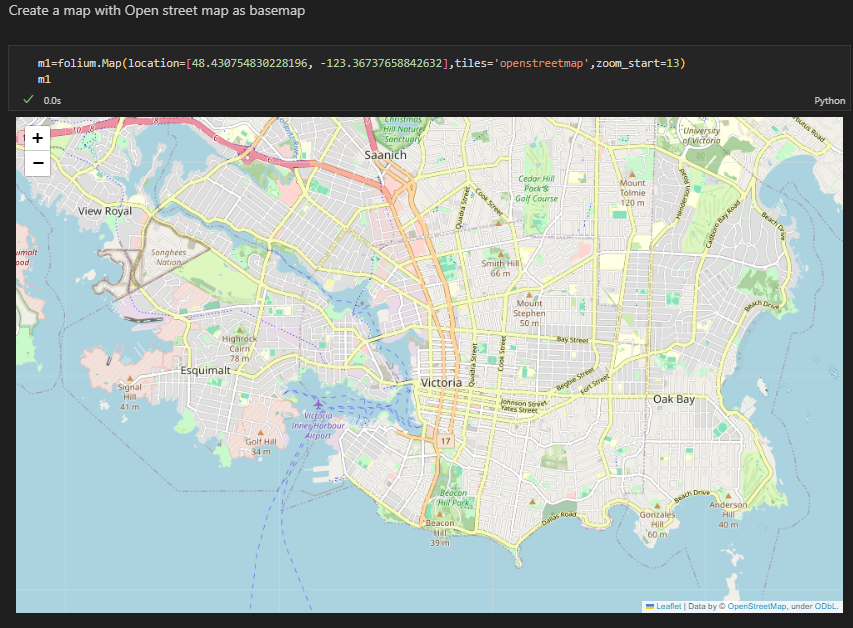
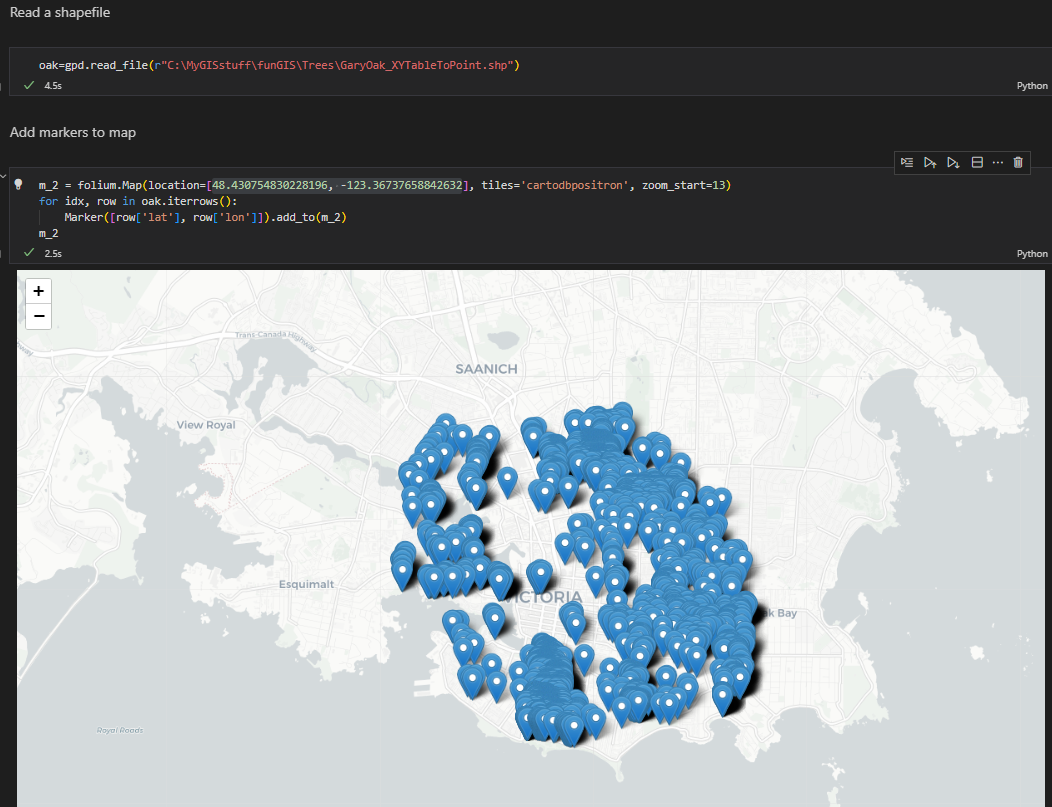
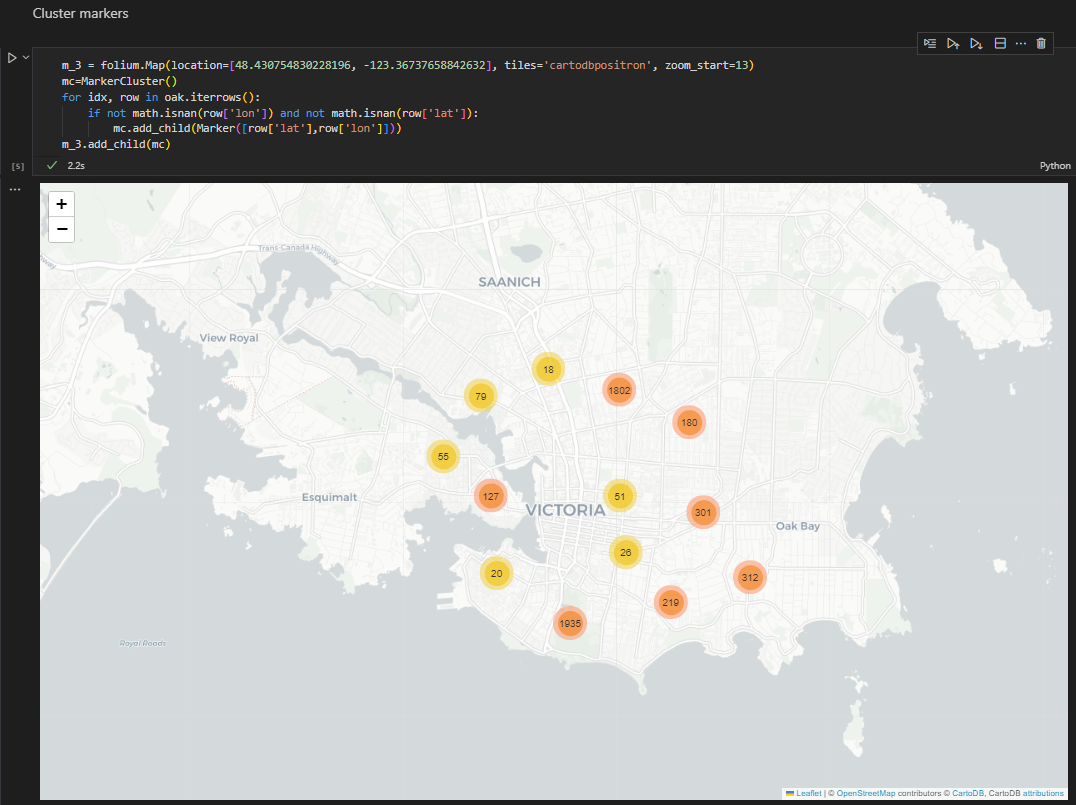
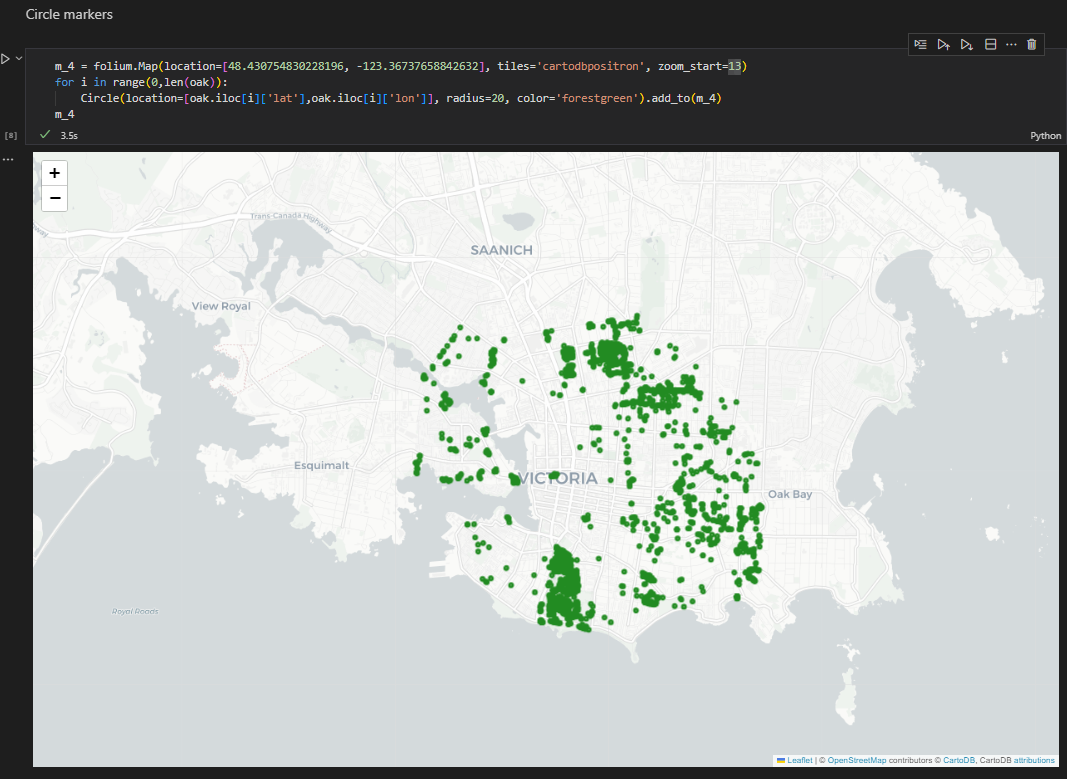
The process begins by setting up a basemap centered on the City of Victoria coordinates. Next, I load a shapefile containing the locations of Garry Oak trees and, using a for loop on the GeoPandas dataframe, I generate markers for each tree. To improve map readability, I use MarkerCluster to group nearby trees into clusters, displaying the number of trees per cluster, and apply Folium Circles for additional symbolization with custom radius and color. Finally, I use the HeatMap plugin to visualize tree density, where brighter yellow/orange colors indicate higher concentrations of Garry Oak trees.