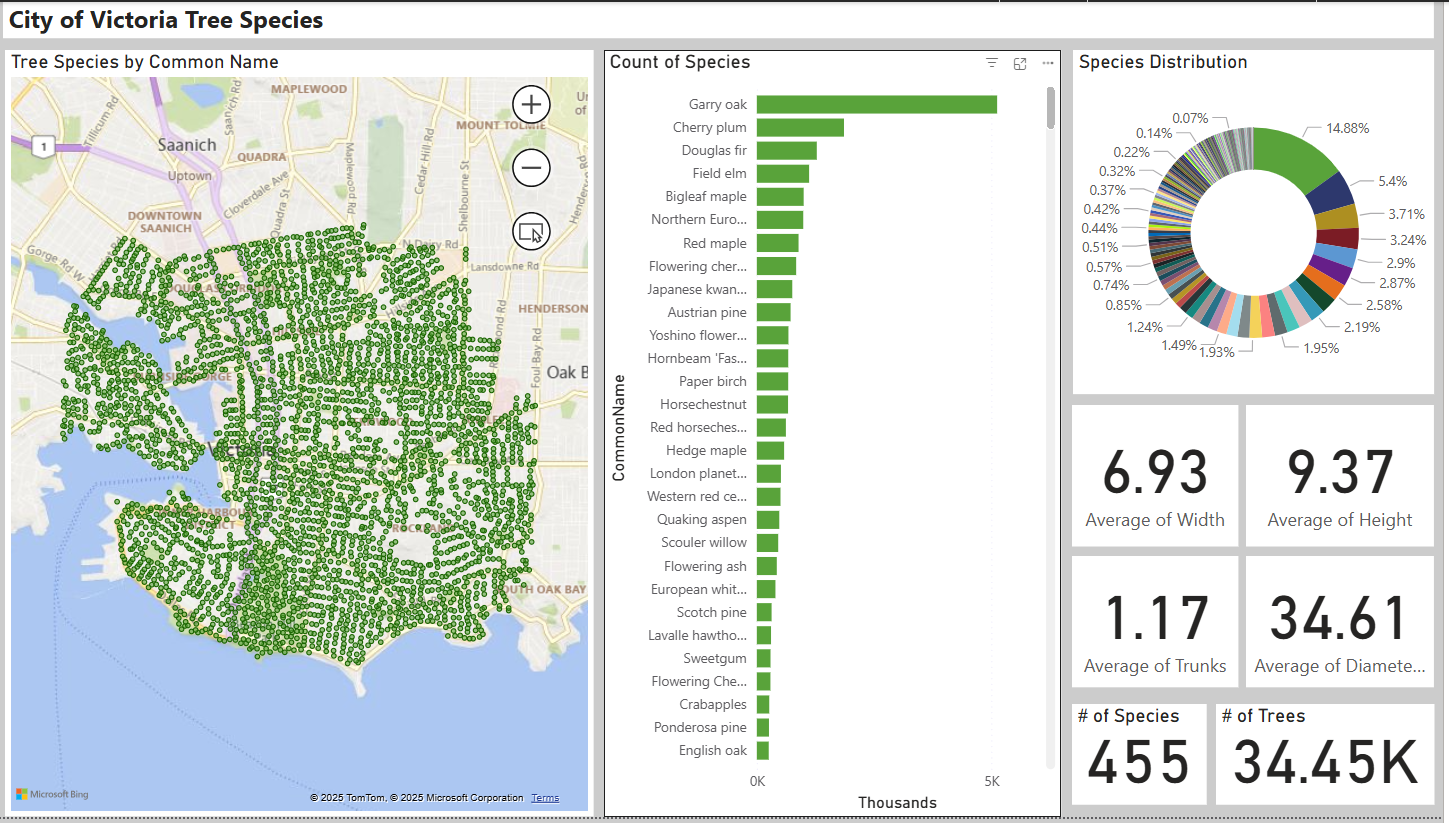
Dashboards are dynamic tools that enable users to visualize and interact with data in real time, offering a clear and comprehensive view of key metrics, trends, and patterns. Platforms such as ArcGIS Dashboards, Google Looker, and Microsoft Power BI make it easy to build intuitive, data-rich visualizations tailored to various audiences and purposes. Below are examples of dashboards created using these tools, leveraging open data published by the City of Victoria, BC.
Dashboard created using ArcGIS Dashboards:
Dashboard created using Google Looker Studio:
Dashboard created using Microsoft Power BI: