
This collection of thematic maps was inspired by the brilliant work showcased at the Esri User Conference 2025, presented by John Nelson, Ken Field, and other incredible GIS professionals. I was especially drawn to their creative approaches to mapping complex data — so I decided to recreate some of their ideas using the UN World Happiness Index dataset (credit: John Nelson). The dataset ranks countries by happiness levels and includes key contributing factors such as: GDP per capita, Social support, Life expectancy, Personal Freedom, Generosity, and Trust in government. These maps explore how each factor shapes global well-being, demonstrating the power of thematic mapping to reveal patterns, disparities, and unexpected insights.
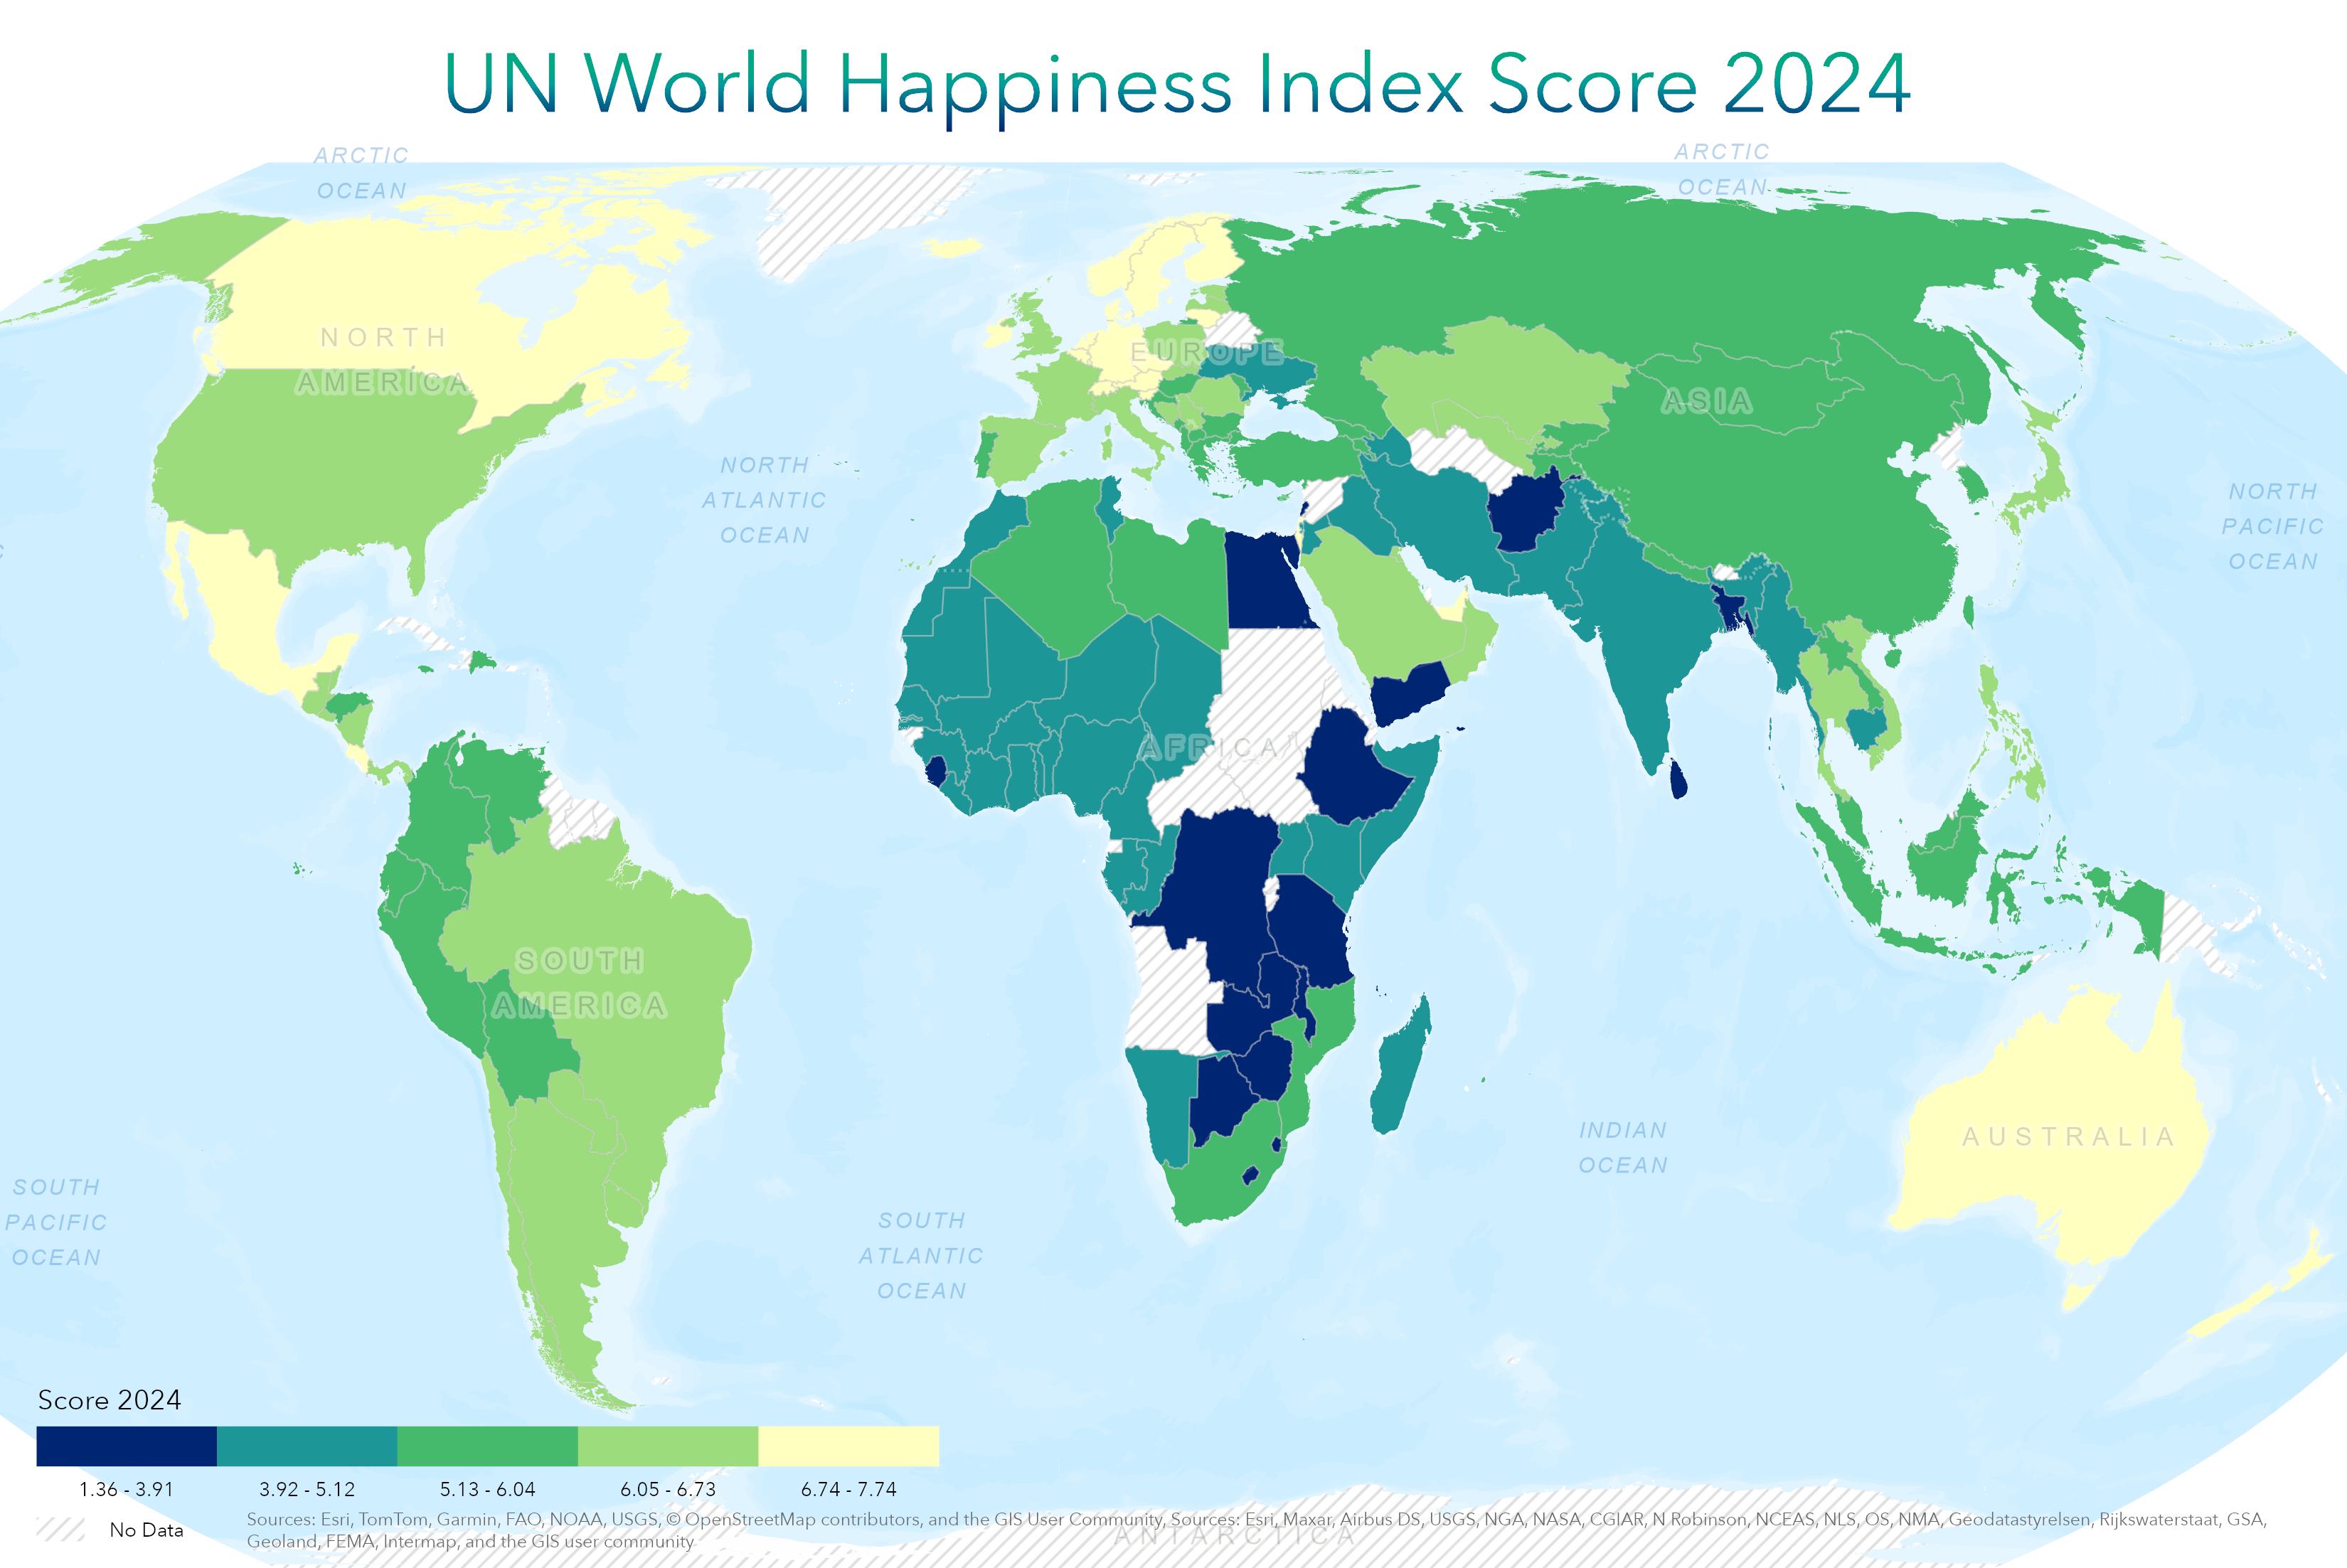
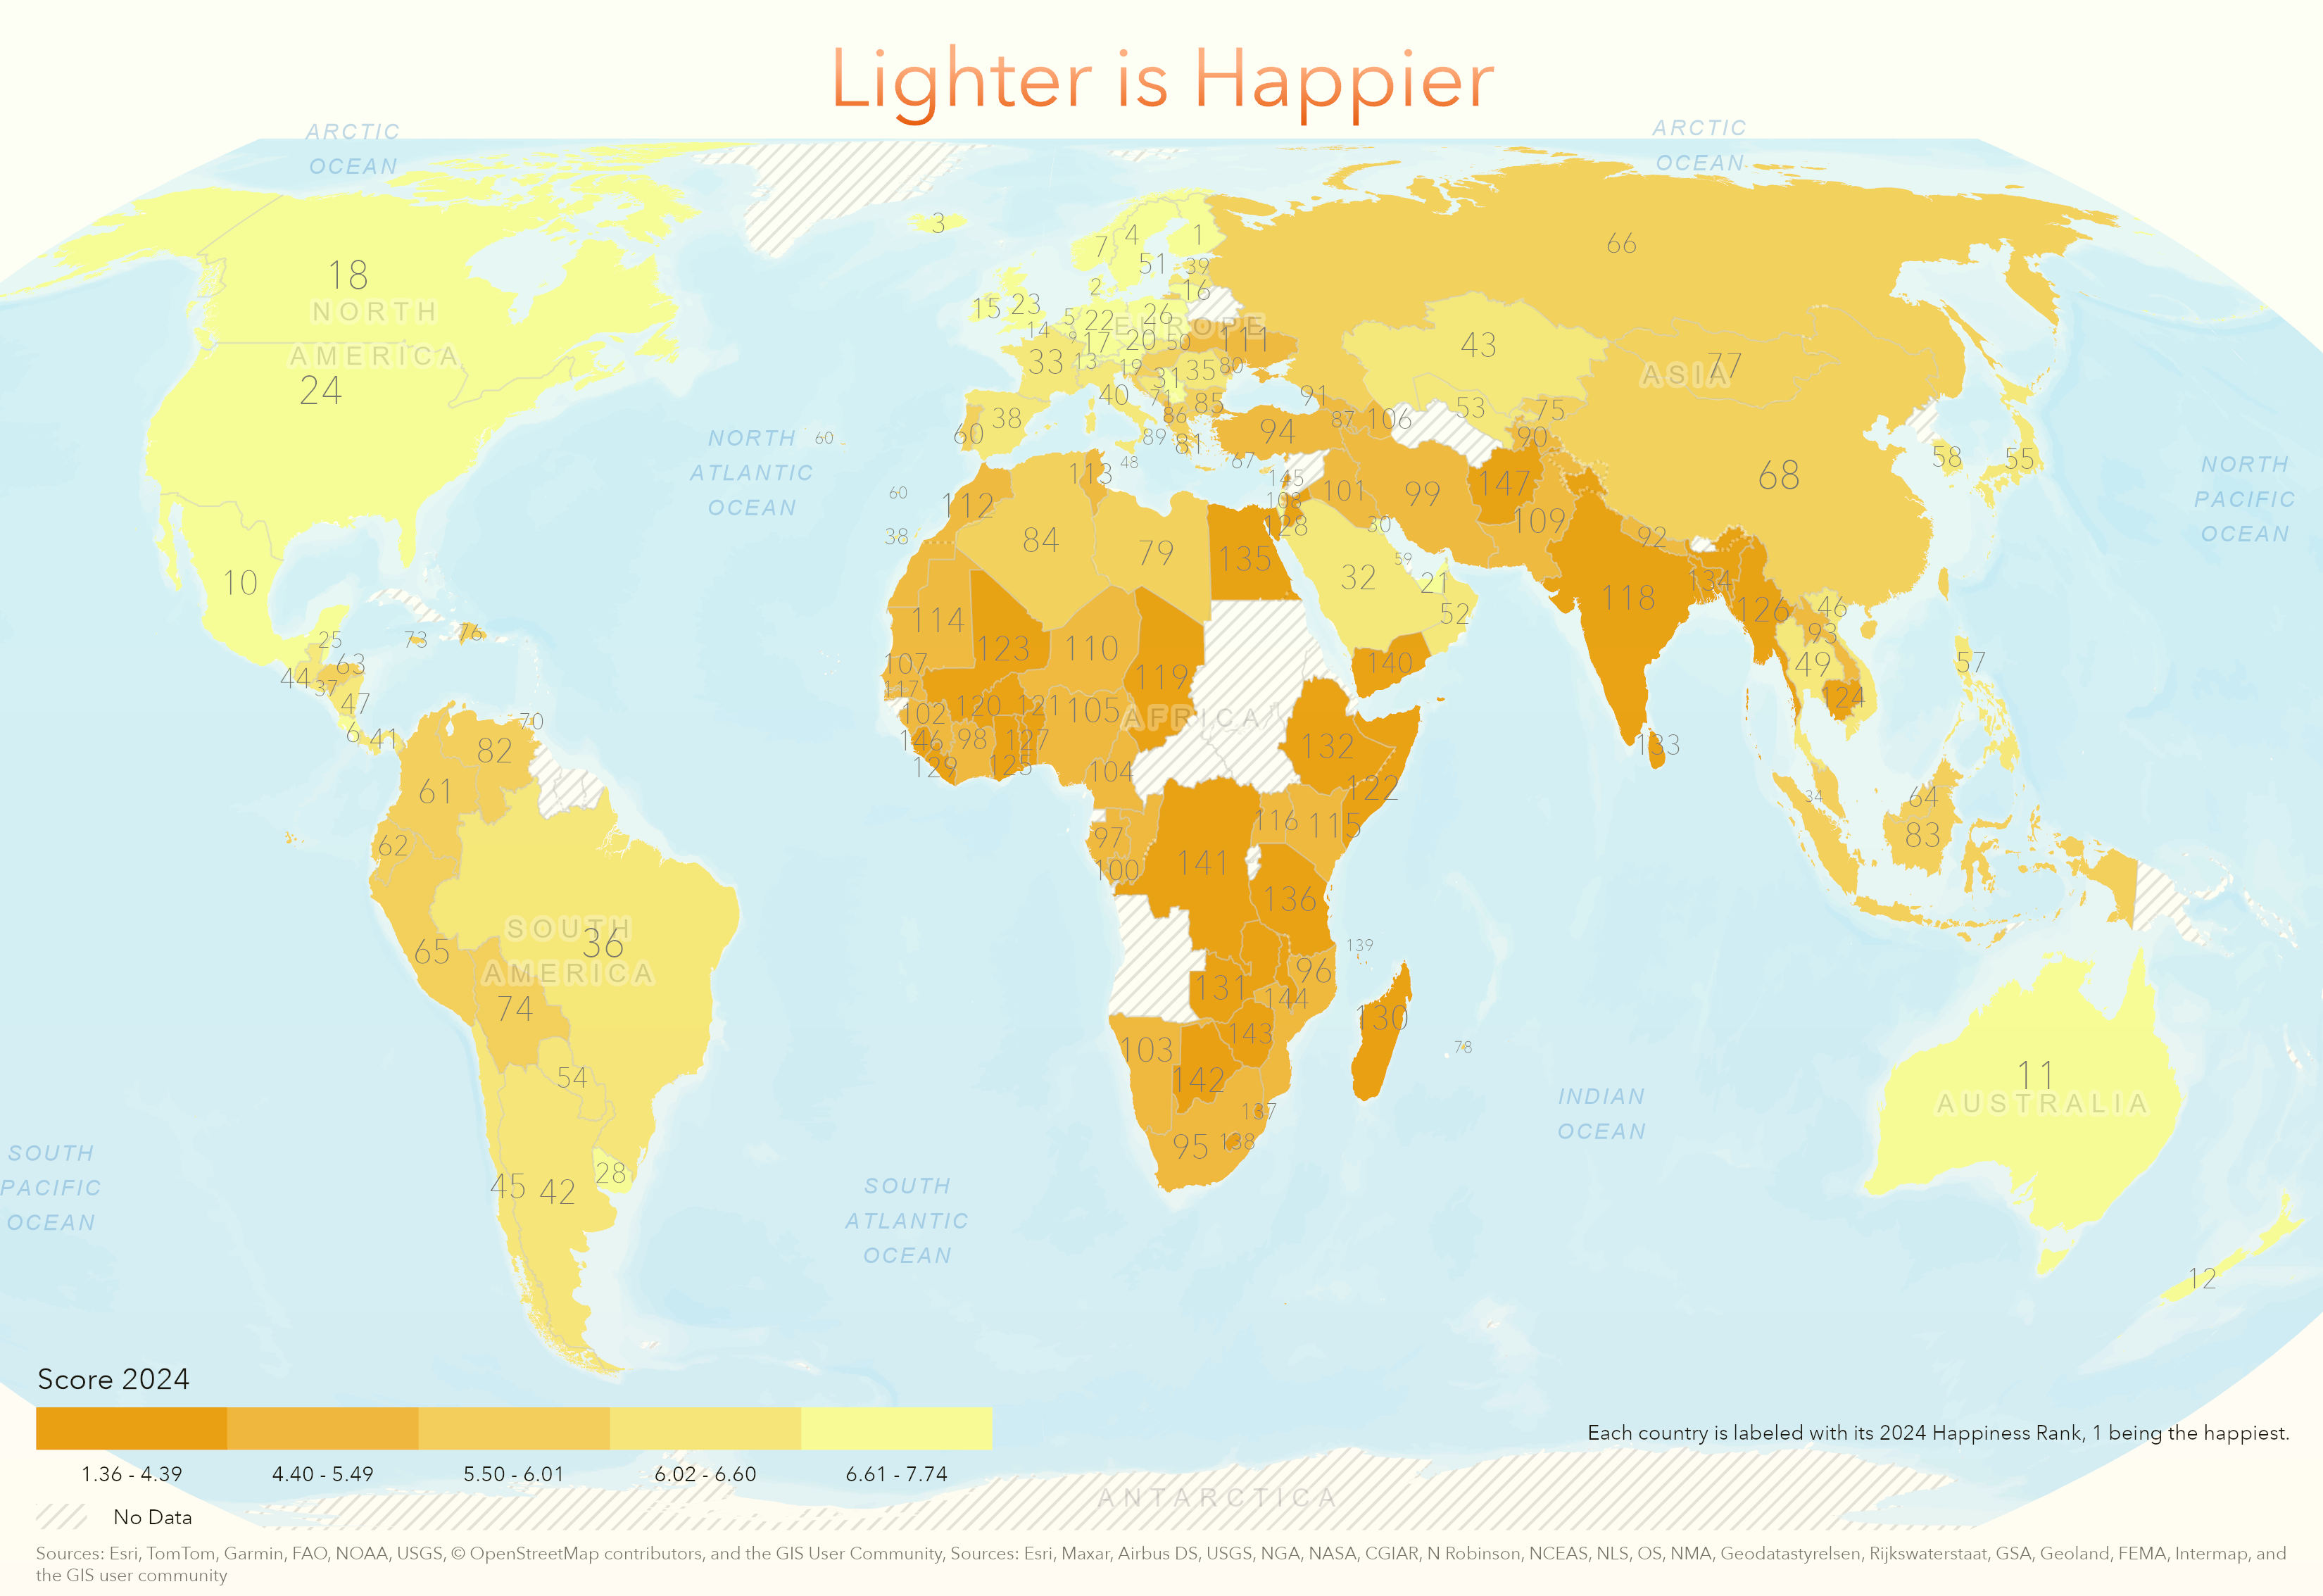
😊 Mapping Happiness: What Color Feels Happy?
- Choropleth map showing Happiness Scores for 2024
- Colors of Happiness: lighter shades indicate happier countries
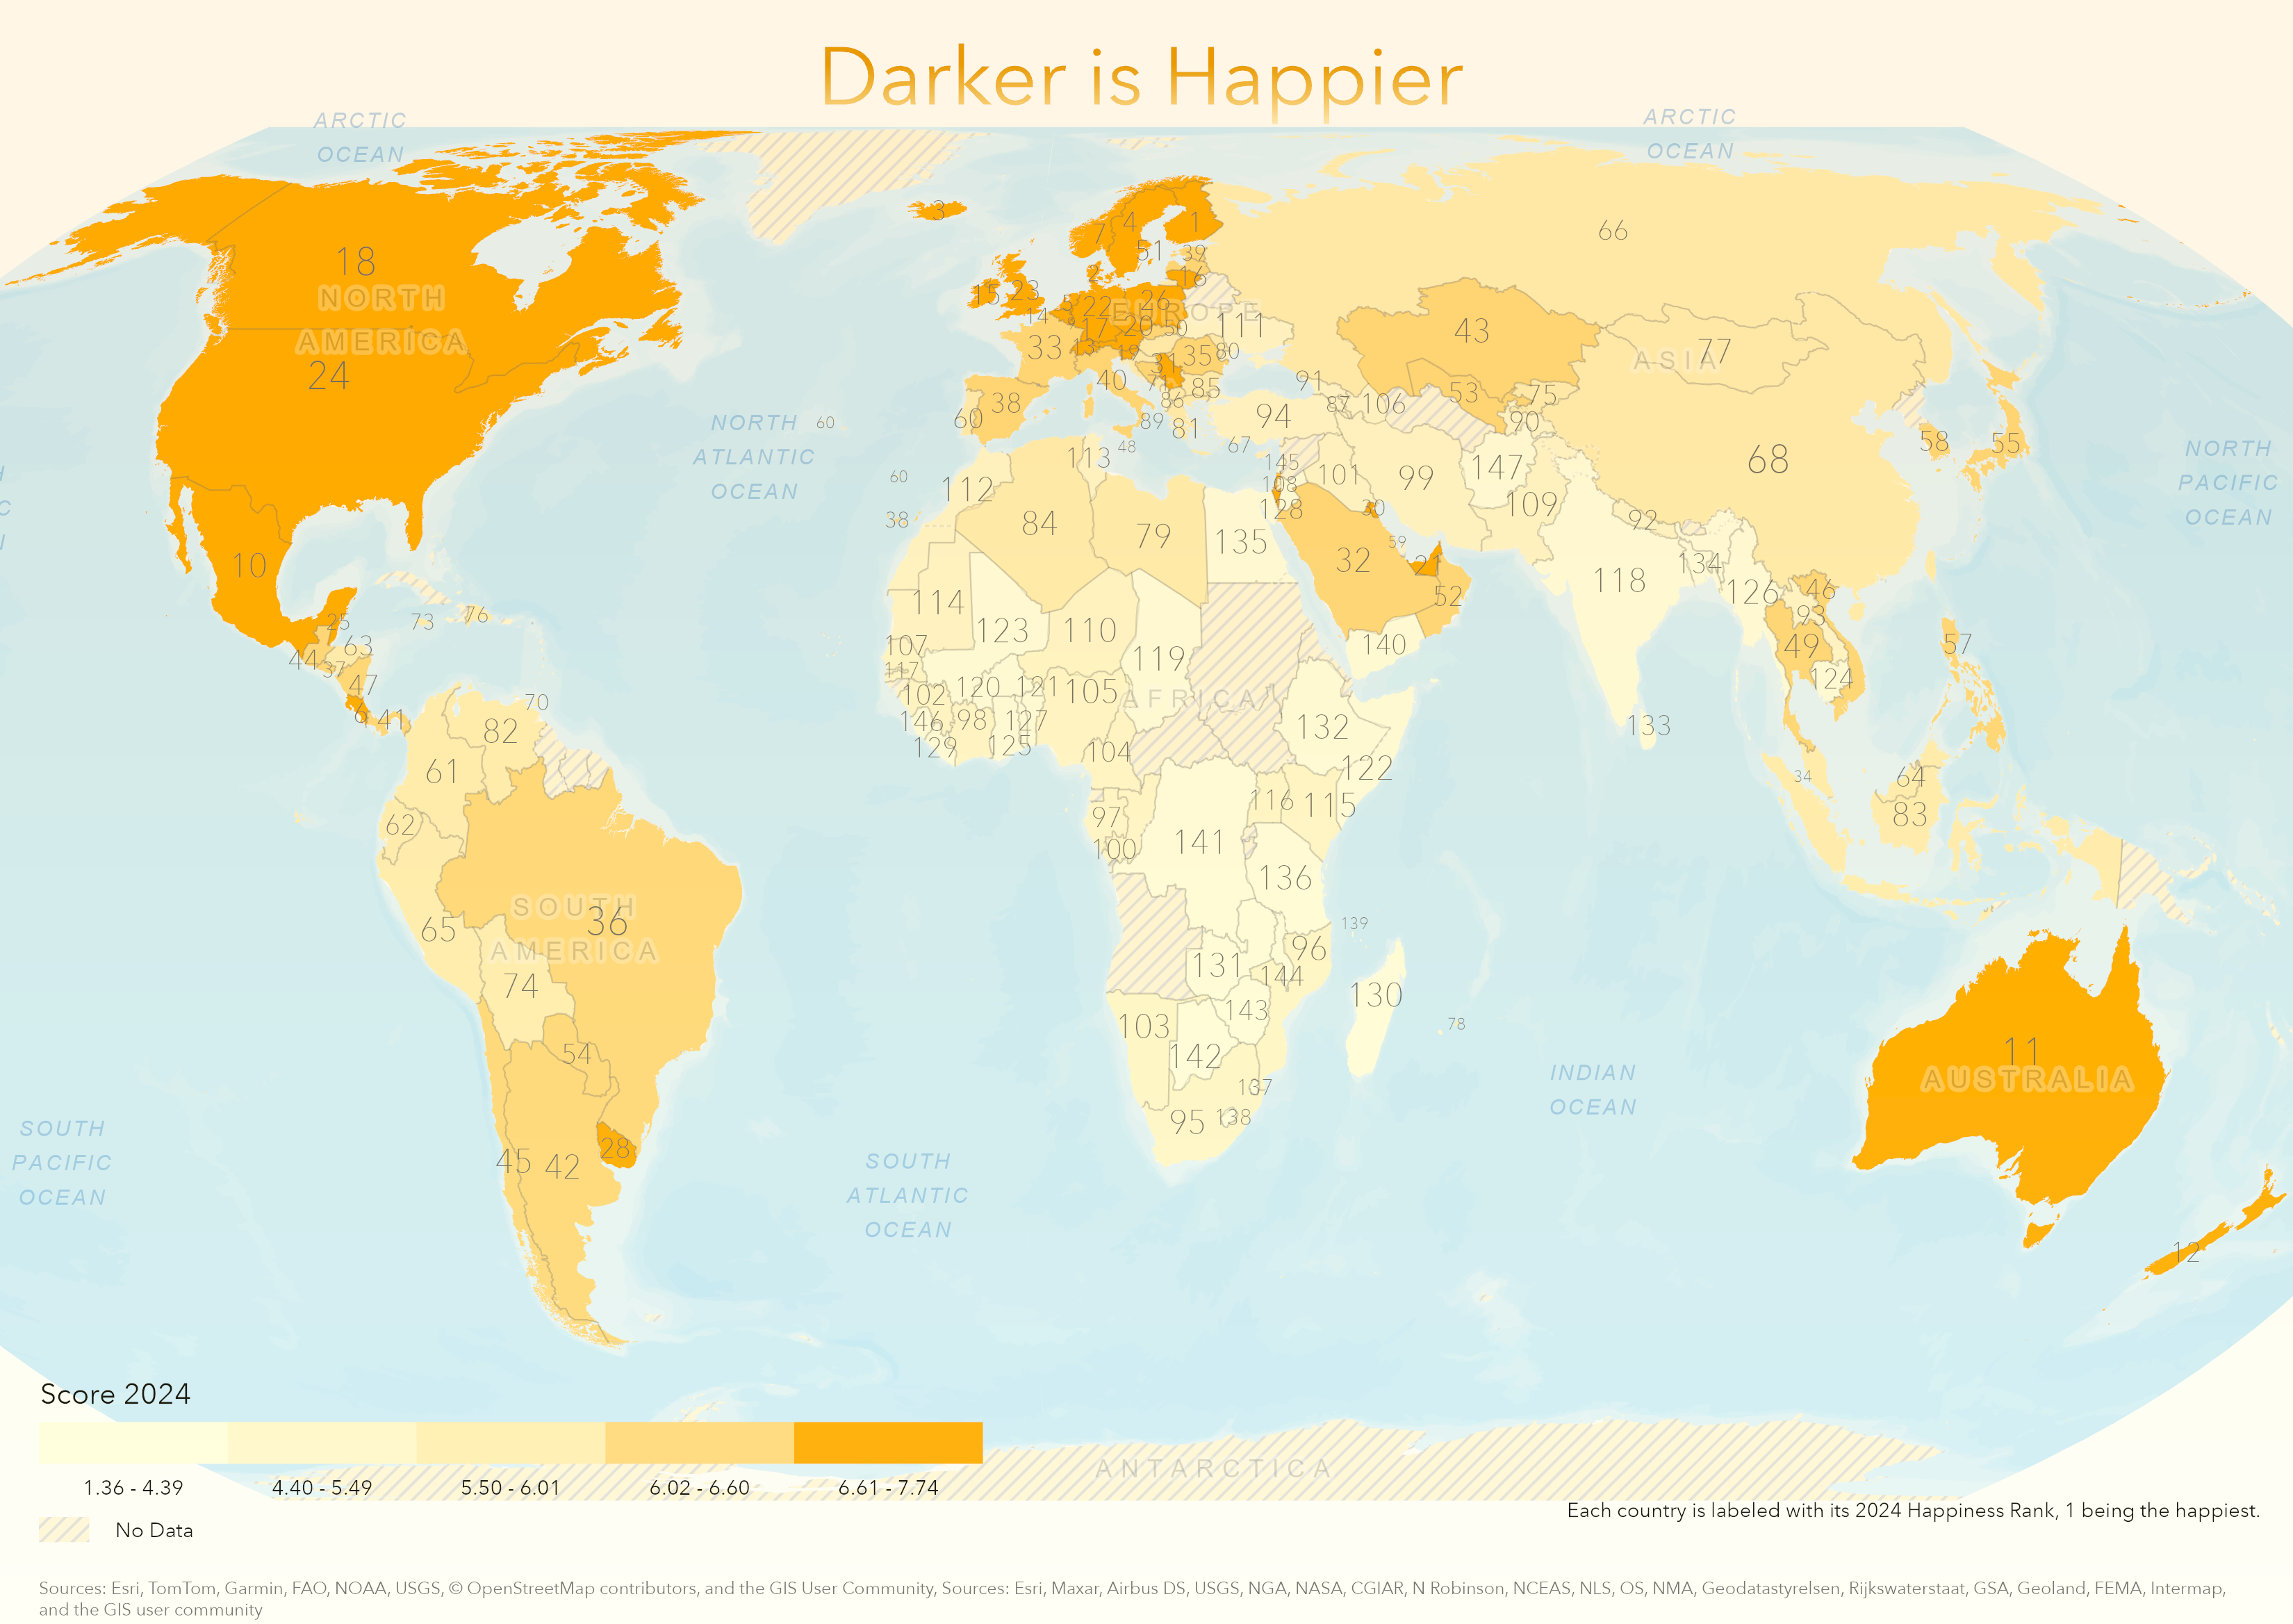
- Or darker shades indicate happier countries. Each country is labeled with its happiness rank, offering a quick visual comparison
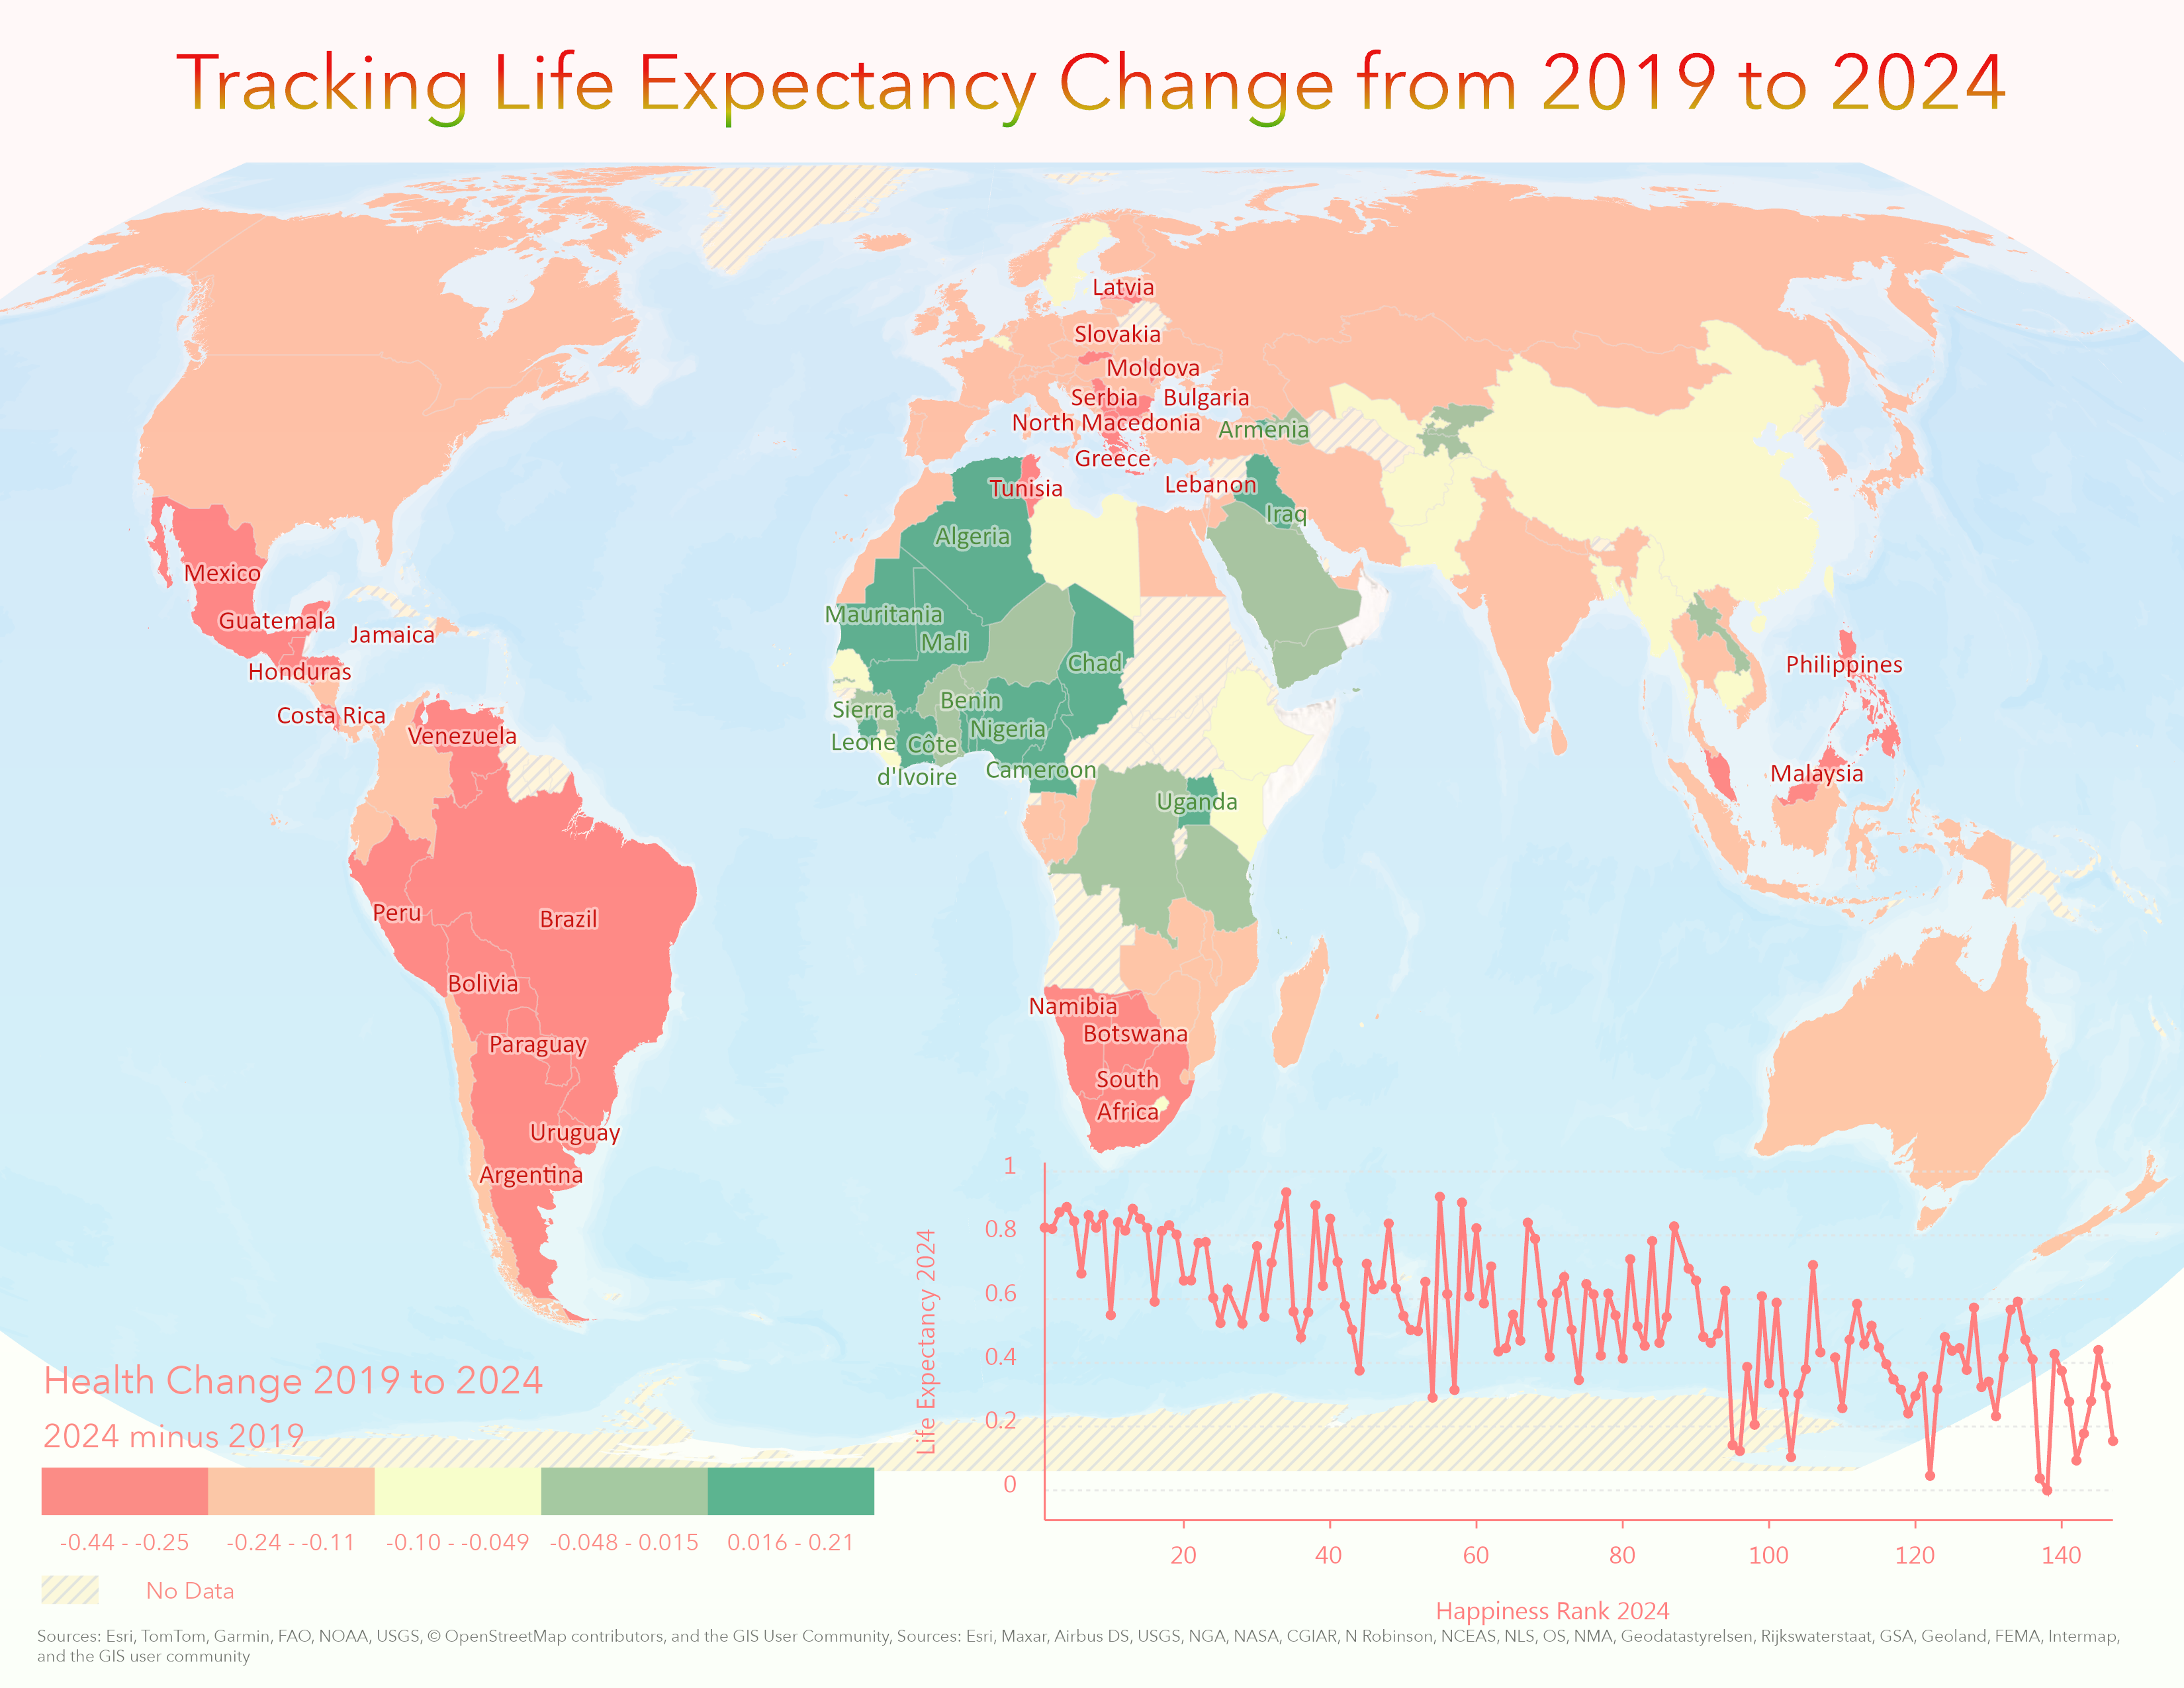
🔄 Mapping Change: Are We Happier and Healthier Now?
Map of health or life expectancy score change from 2019 to 2024, labelled with extremes. Chart shows how changes in health scores correlate with shifts in happiness rankings
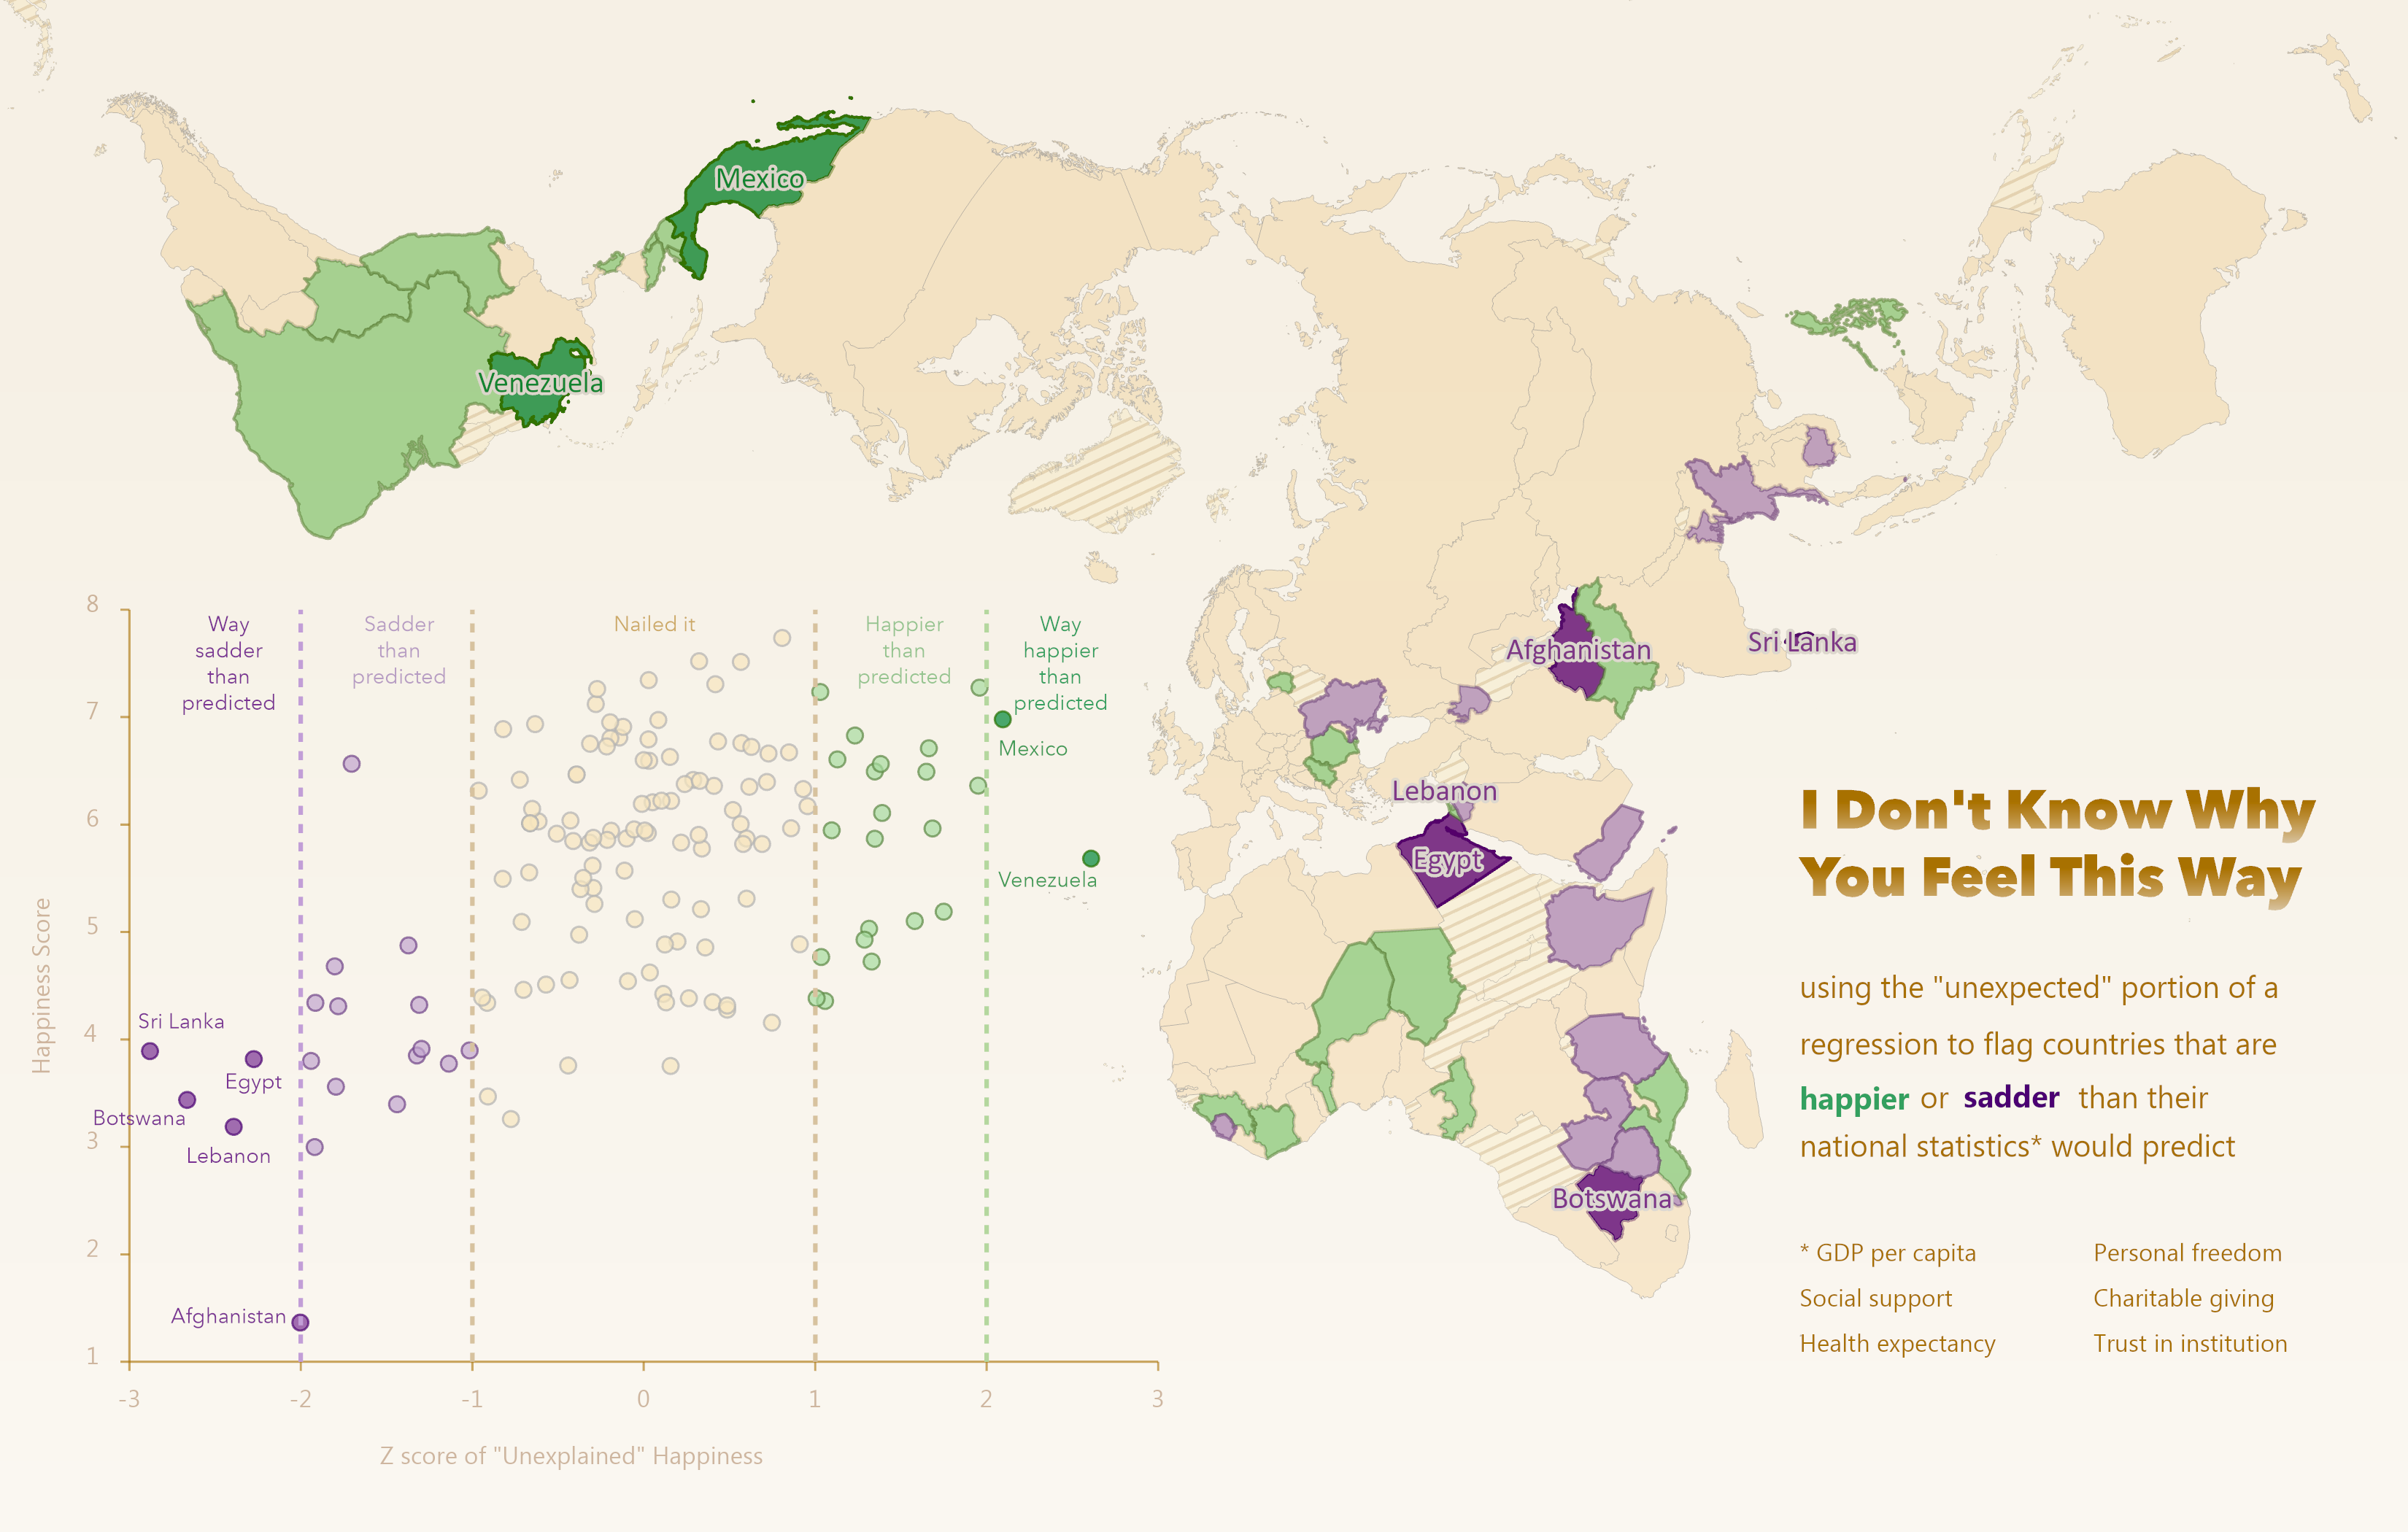
❓ Mapping Uncertainty: The Gap Between Stats and Sentiment
Map visualizing the discrepancy between national statistics and actual happiness score. Z-scores were used to show where official metrics either overestimate or underestimate how happy people feel.
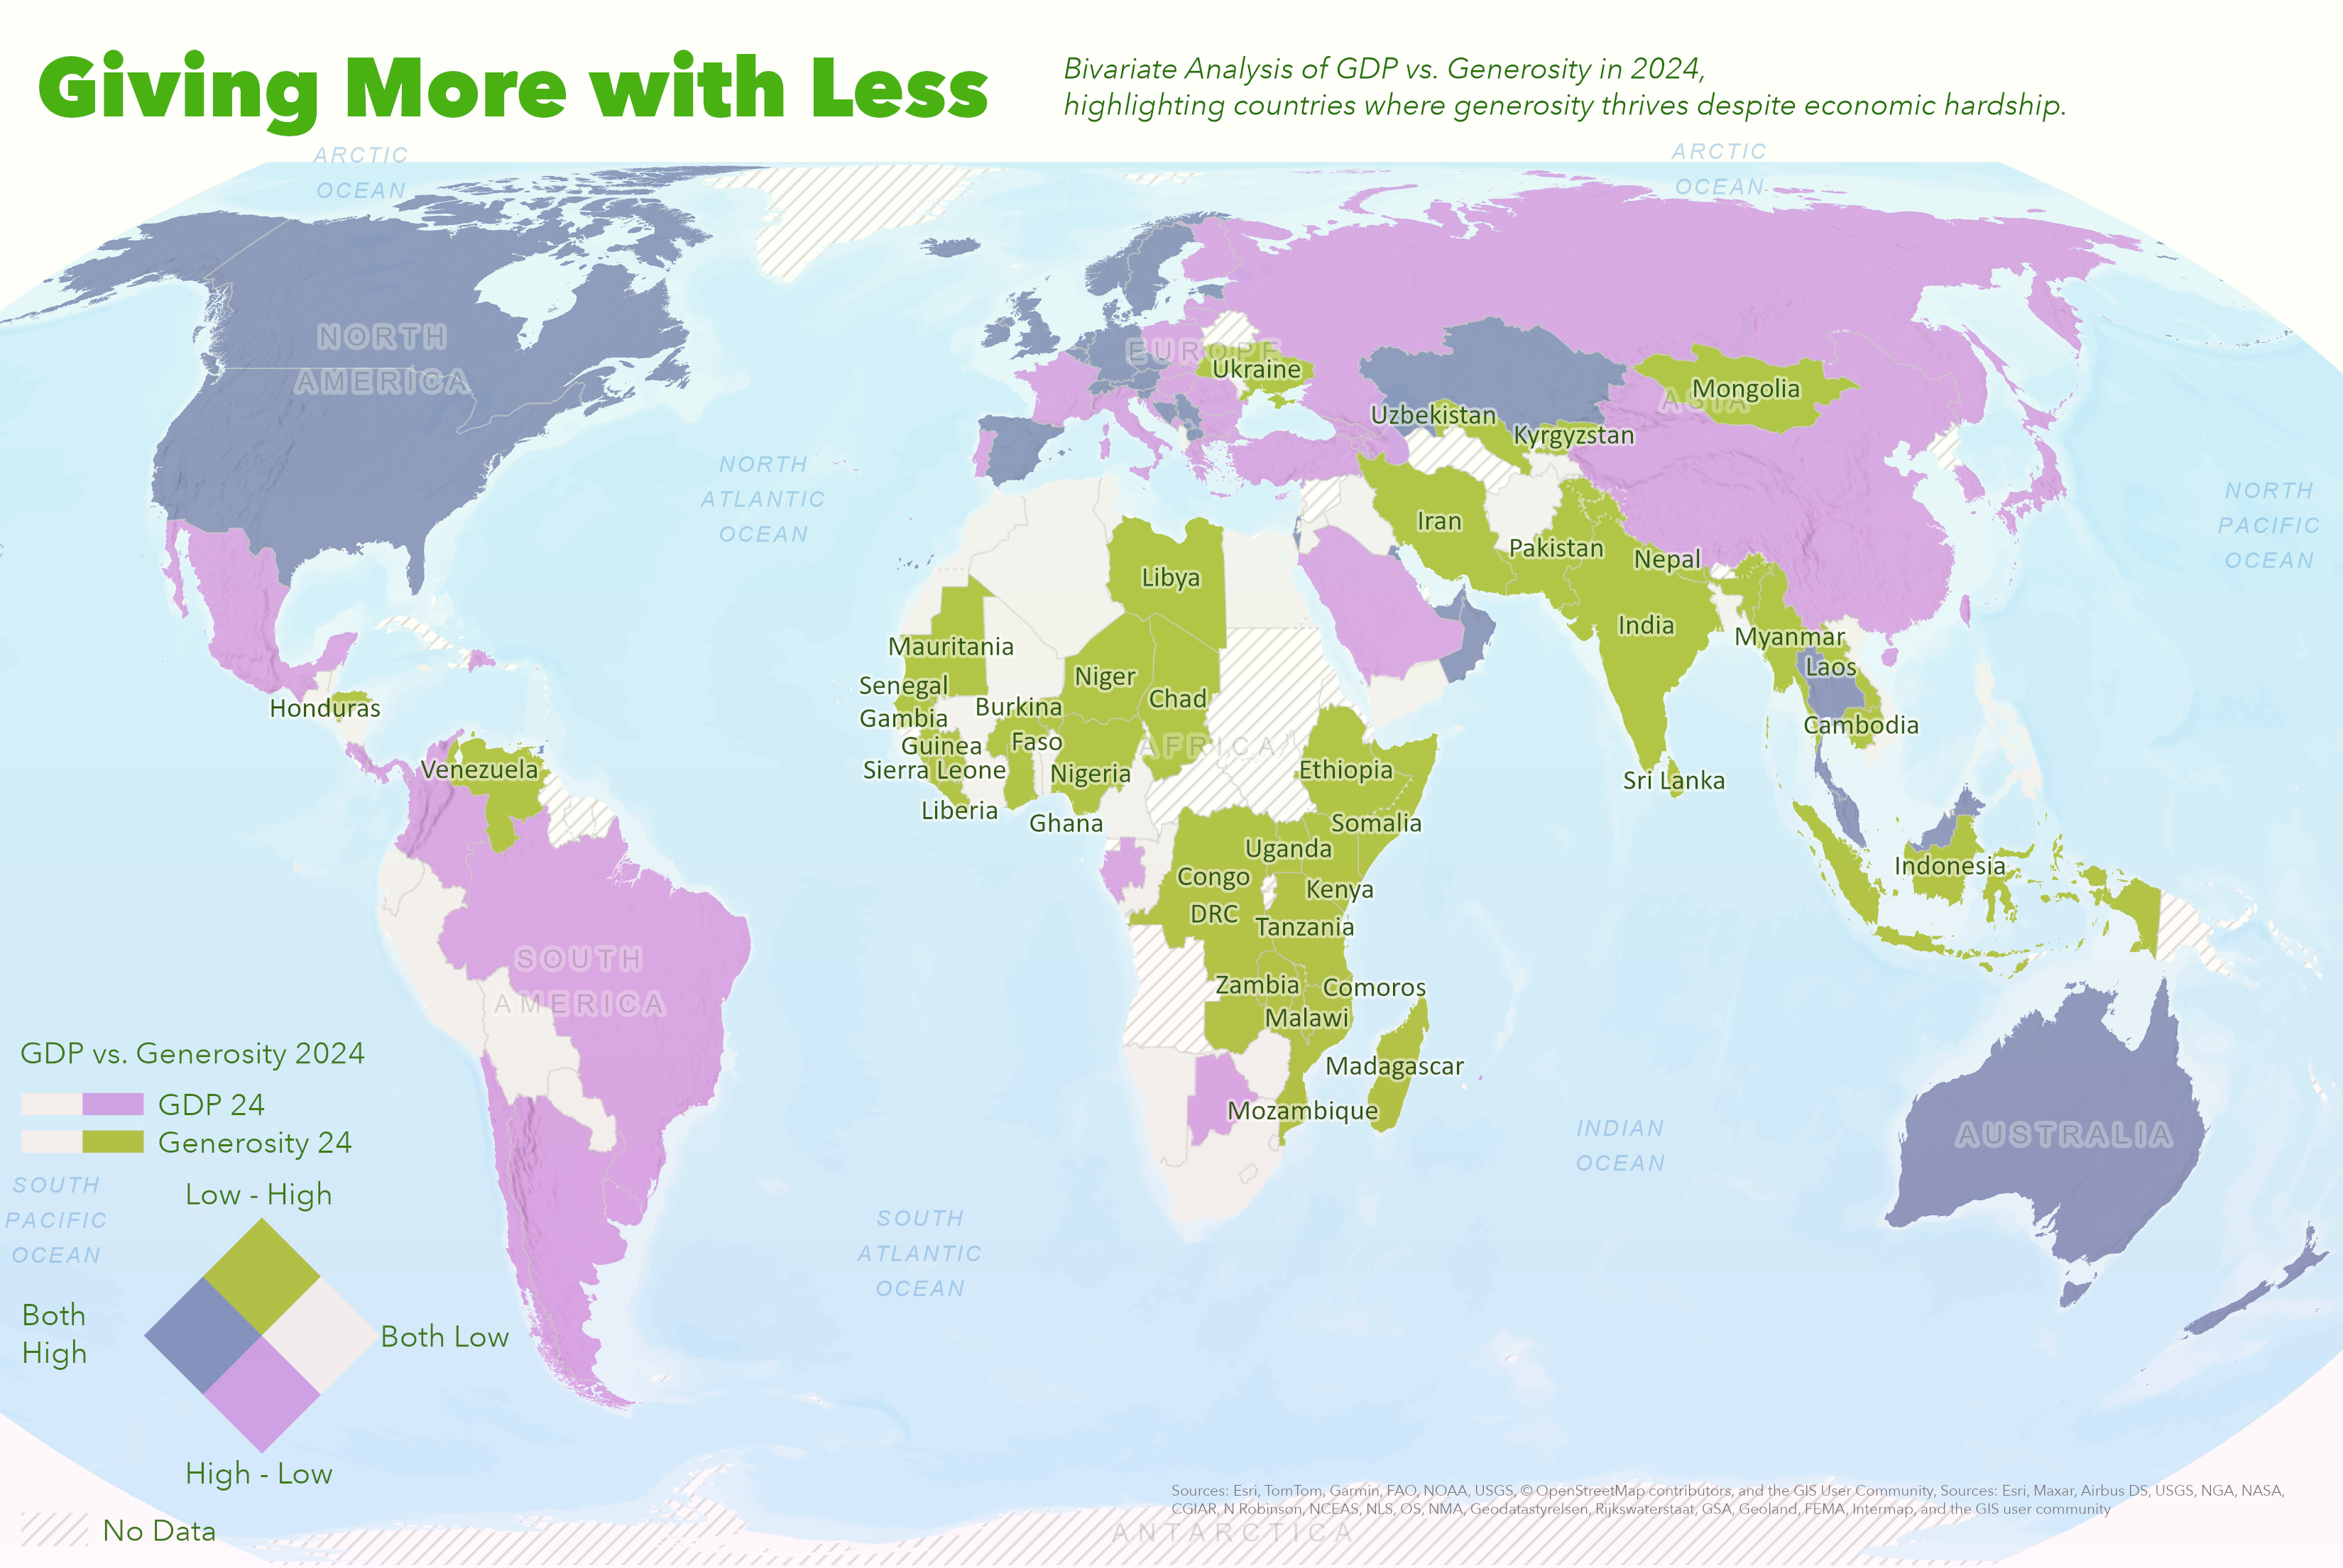
💖 Mapping Generosity beyond GDP: Giving from the heart
Map highlighting countries that rank high in generosity despite having low GDP per capita
🗺️ ArcGIS Online Web Map
This interactive web map uses Arcade expressions to dynamically label countries based on zoom level. Use the bookmarks (found under (i) button in the map viewer) to quickly navigate and see how labels change at different zoom levels. For example, zooming in to continent level reveals rank numbers, zooming in further to country level reveals rank, country name, and score, and zooming in even further to state level reveals full statistics.